Chrome DevTools provides amazing features to debug source code, capture element state, update and test the element properties, emulate the various device environment, and many more things.
In this article, we will see many important rendering, screenshot and console features of Chrome Developer Tools.
In further updates, I will add more features related debugging in chrome.
So let’s get started with the best chrome devtools tips and tricks…
Chrome DevTools Tips Categories
Rendering and Screenshot Related Tips
Many times we required to capture the screenshot of the webpage, We generally use the snipping tool to capture the screenshot or if we want to capture the full page screenshot we use chrome extensions.
We can avoid using such tools by using the Chrome DevTools feature.
Chrome DevTools gives an option to capture the area screenshot, full-page screenshot, DOM node screenshot, and the current view screenshot.
To Capture the Screenshot Open Chrome DevTools > Open Command Panel with Ctrl + Shift + P > Type `Capture` it will show you suggestions related to screenshot > select the option.
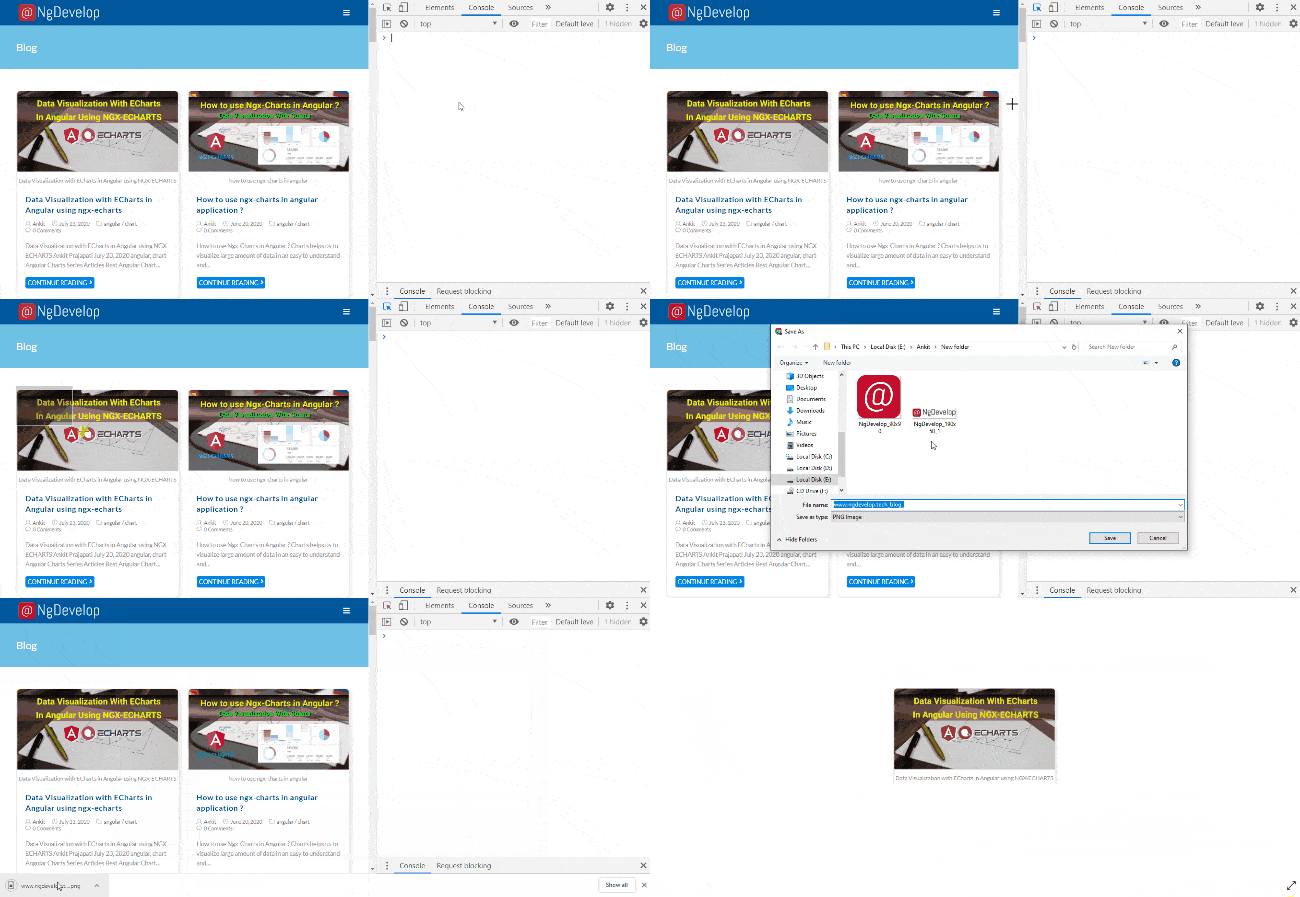
This is a kind of capturing screenshot with the snipping tool. as shown below, when we select the “Capture area screenshot” option it will give you an option to capture area on the webpage.
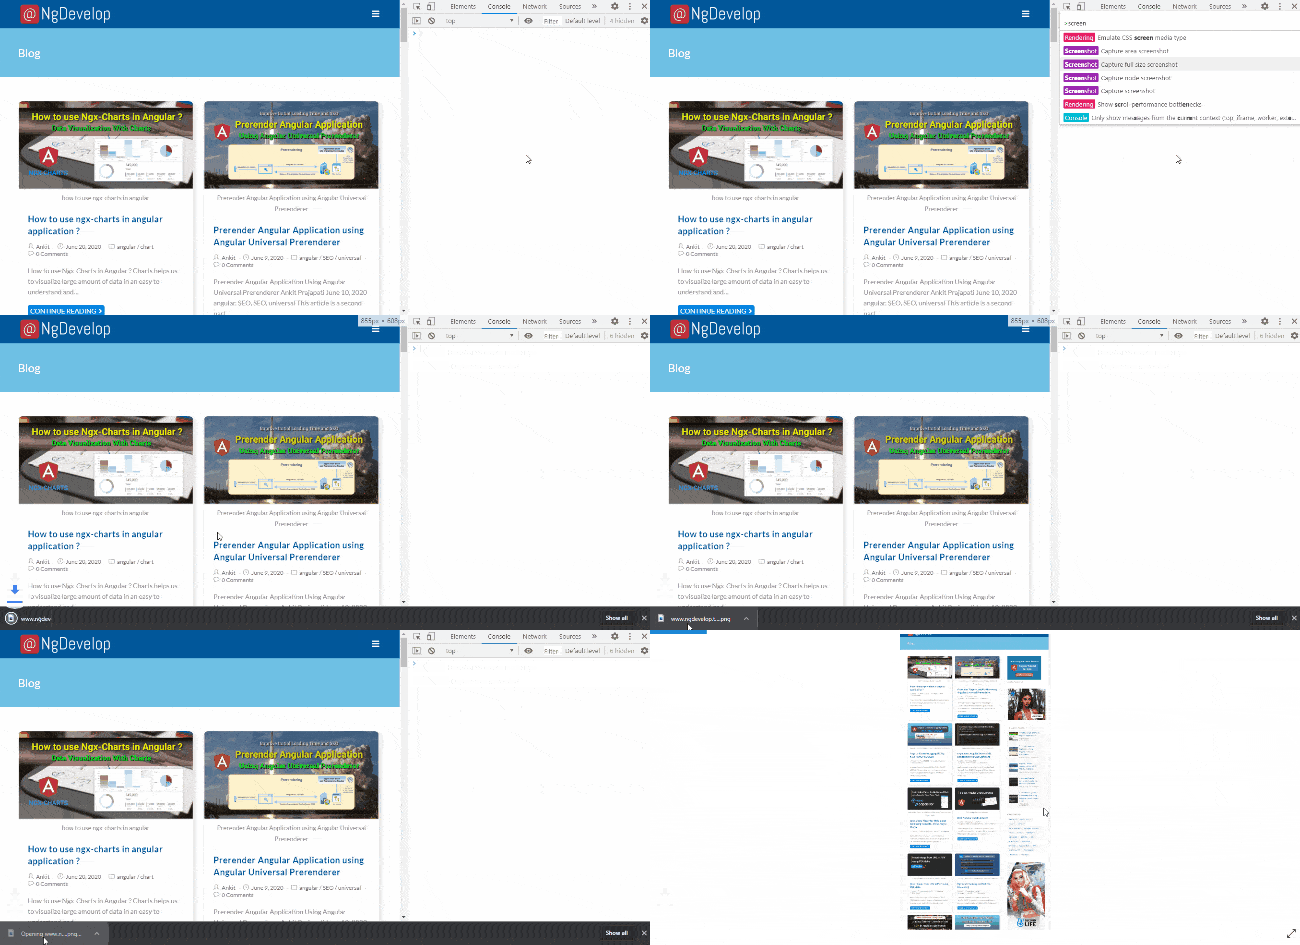
Many times we required to capture the full page screenshot, We can capture it using Chrome DevTools, “Capture full-size screenshot” command, As shown below.
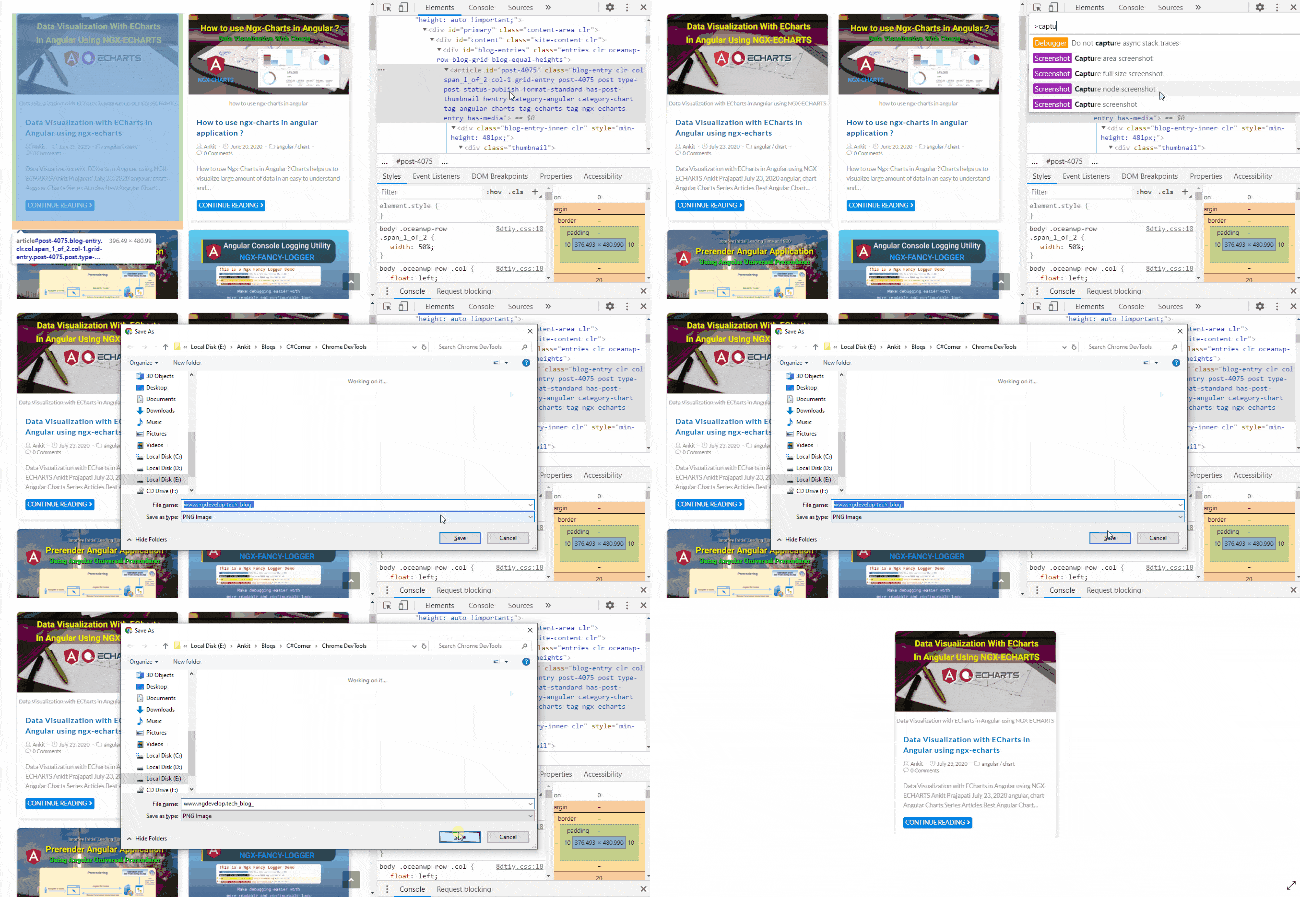
The “Capture node screenshot” feature can be very helpful when we want to capture a particular DOM node. For Example, we can capture a particular div card.
As you can see below, I have captured one article card. For that select the DOM node and execute command “Capture node screenshot”.
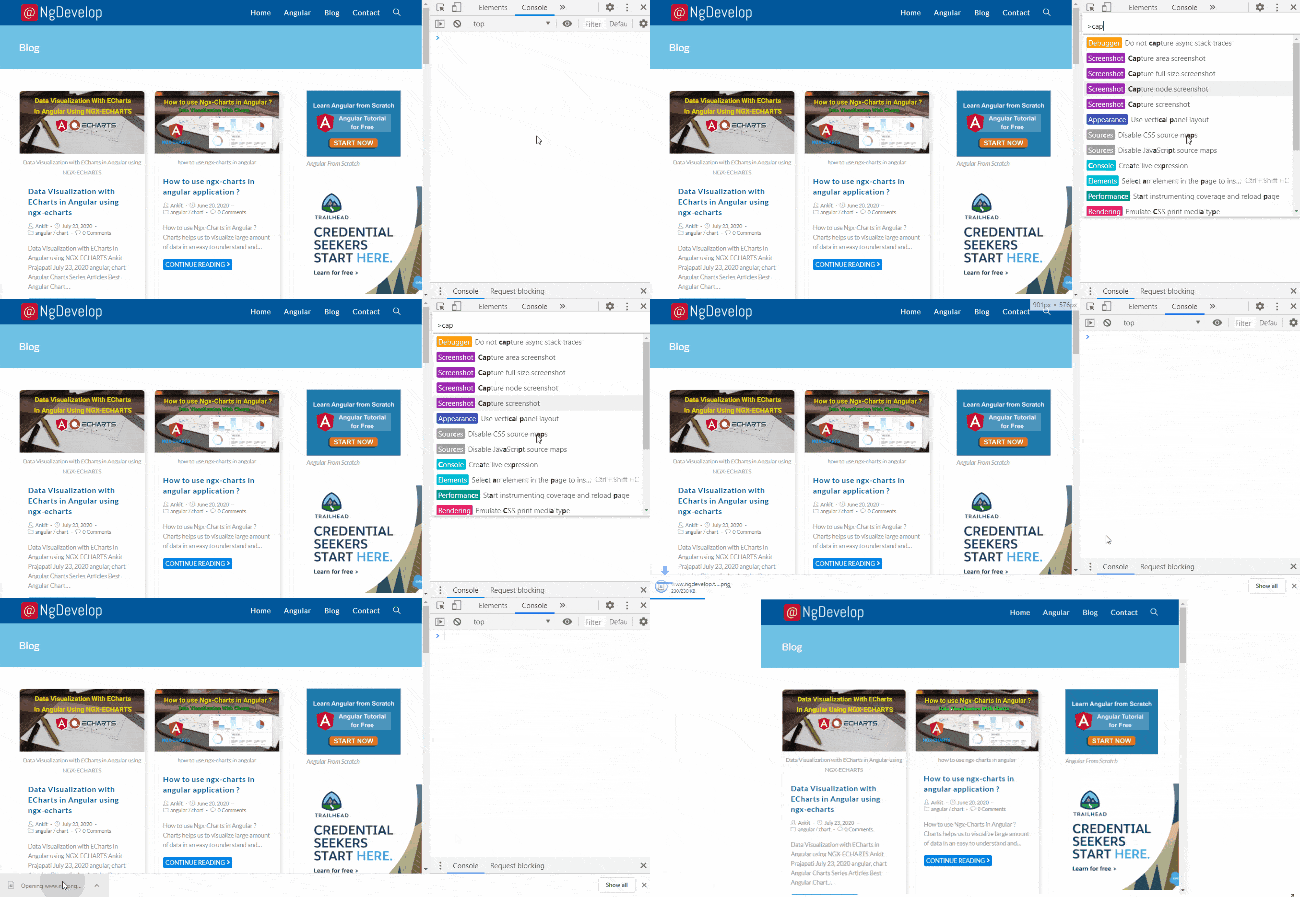
This will capture the screenshot of the current window view.
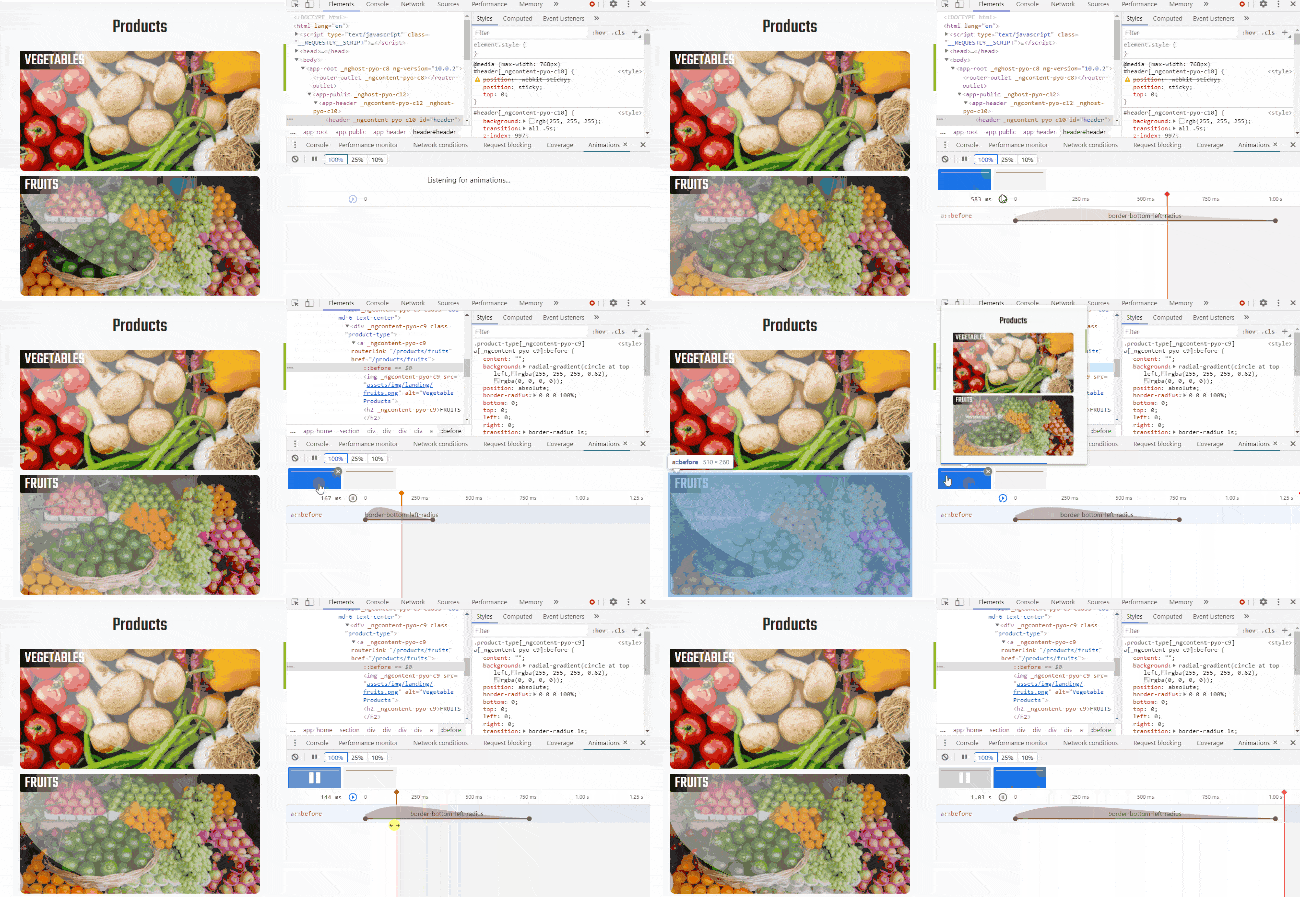
Chrome DevTools provide features to inspect and modify the animations. It helps us to play with an animation sequence, modify the animation time, and analyze view at a particular time frame.
To inspect an animation, Open Animation Tab, and Inspect it as below.
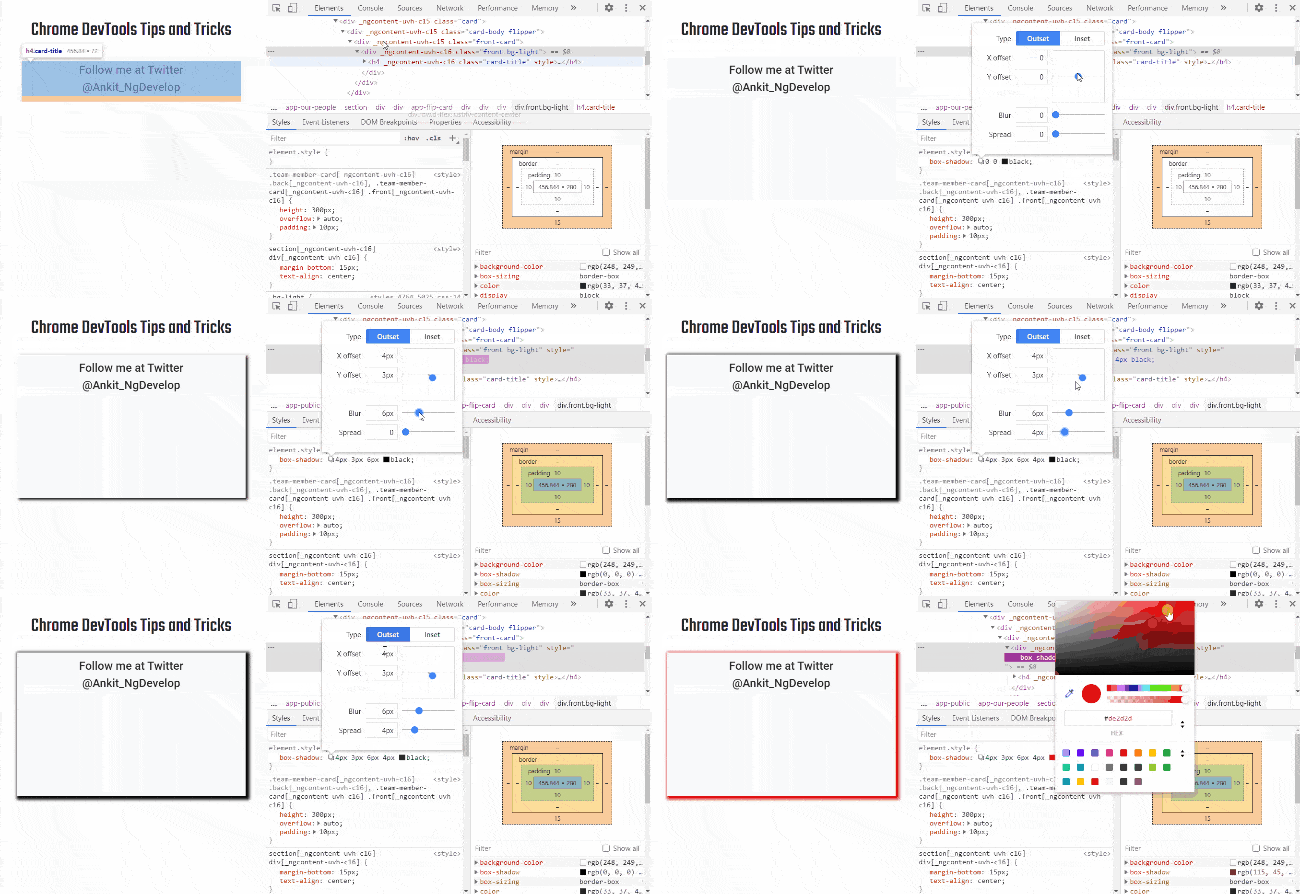
We can easily add a box-shadow on any element with a box-shadow picker. We don’t need to remember all the properties of the box-shadow. Box shadow picker gives the realtime shadow view.
To add a box-shadow declaration to an element:
- Hover over the style rule that you want to add the box-shadow declaration.
- Reveal the More Actions toolbar .
- Click Add Box Shadow Icon.
Same as a Box Shadow Picker, you can use Text Shadow Picker to add text-shadow.
- Shades,
- Eyedropper which allows us to select the color from a page element,
- Switching the color pallets,
- Display value switcher which allows toggling between RGBA, HSLA, and Hex representations of the current color,
- Opacity control,
- Hue control.
- Hover over the style rule that you want to add the background declaration to.
- Reveal the More Actions toolbar.
- Click Add Background Color Icon.
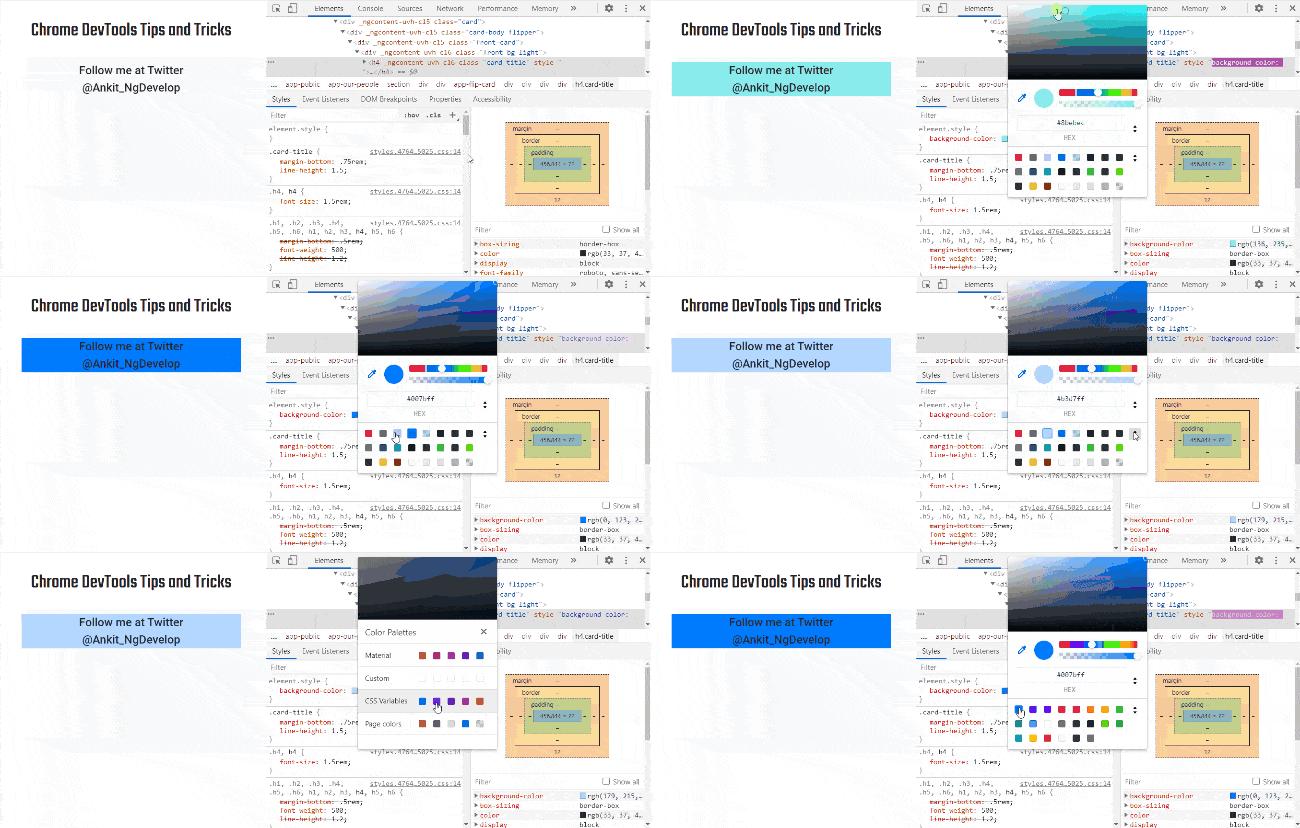
In the same way, we can set the text color.
We can also open the color picker by clicking the color square box displayed with the color HEX code.
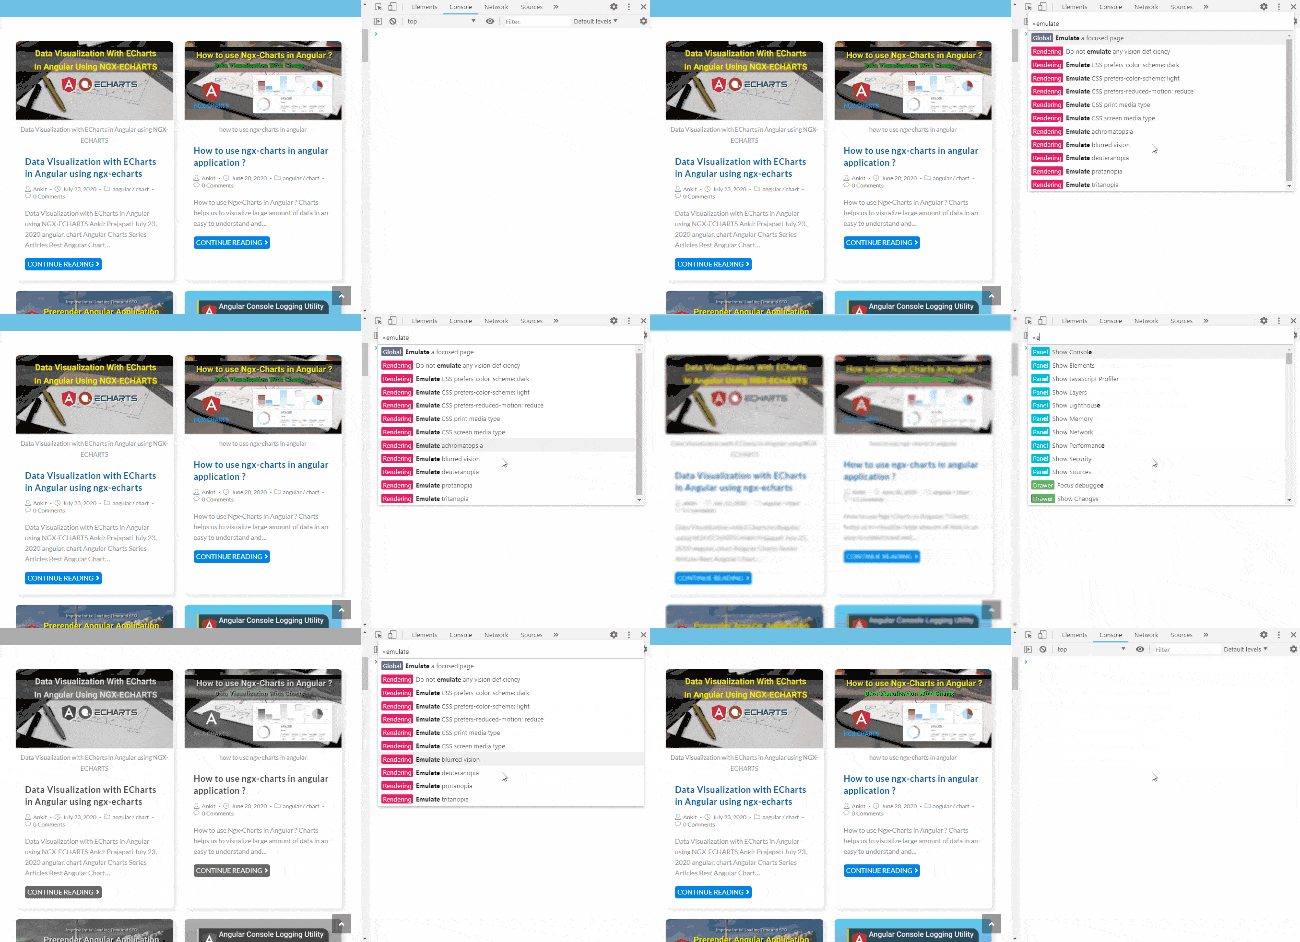
Chrome DevTools v83 added a new feature to emulate vision deficiencies to get a better idea of how people with different types of vision deficiencies experience our site.
DevTools provide commands to emulate the color vision deficiencies like
- Protanopia: the inability to perceive any red light.
- Deuteranopia: the inability to perceive any green light.
- Tritanopia: the inability to perceive any blue light.
- Achromatopsia: the inability to perceive any color except for shades of grey (extremely rare).
We can emulate vision deficiencies with two ways,
To emulate blurred vision, One way is: Open command panel (using Ctrl + Shift + P) > Select emulate blurred vision. In the same way, we can emulate other vision deficiencies.
Another way is: Open the Rendering Tab > Select the vision deficiency from the emulate vision deficiency dropdown
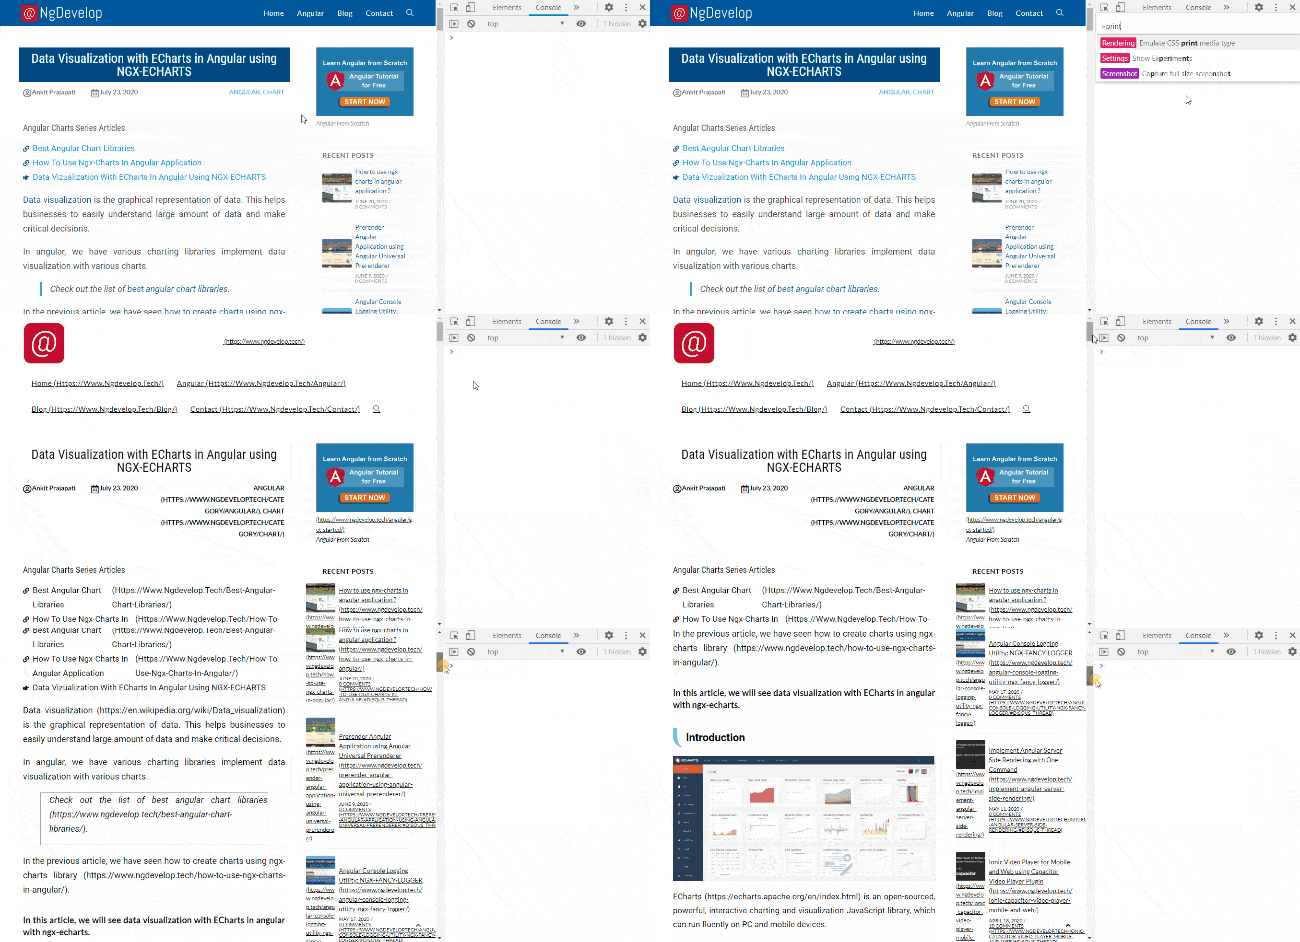
We can control the print view of our page using the print media query. It allows us to show/hide the DOM Elements, changing the size of fonts and other CSS things to control page view while we print it.
Chrome DevTools provides a feature to emulate the print preview mode. We can use it to inspect the print preview.
To Emulate Print Preview : Open Command Panel (using Ctrl + Shift + P) > Select Emulate Print Media Type
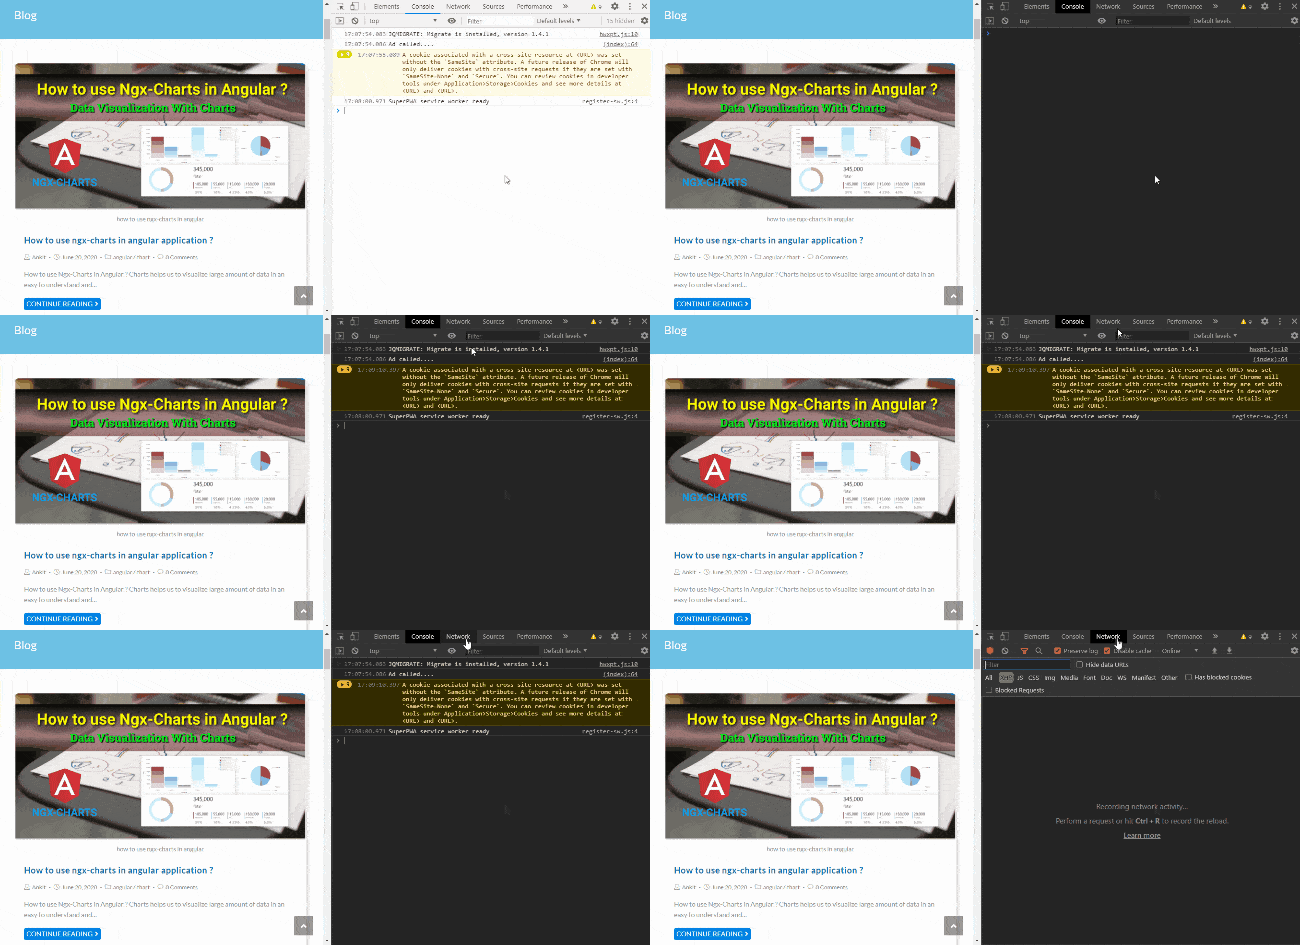
Chrome DevTools support the dark and light theme. You can switch to this using the Command Panel or updating the theme in Settings.
Open Command Panel (using Ctrl + Shift + P) > Switch to Dark Theme
Previously, to copy the string representation of an object in the clipboard, I was generating the string of it with JSON.stringify(object) and manually selecting the text to copy it.
copy(object)
Copy function helps us to directly copy an object in the clipboard.
copy(object)copies a string representation of the specified object to the clipboard.

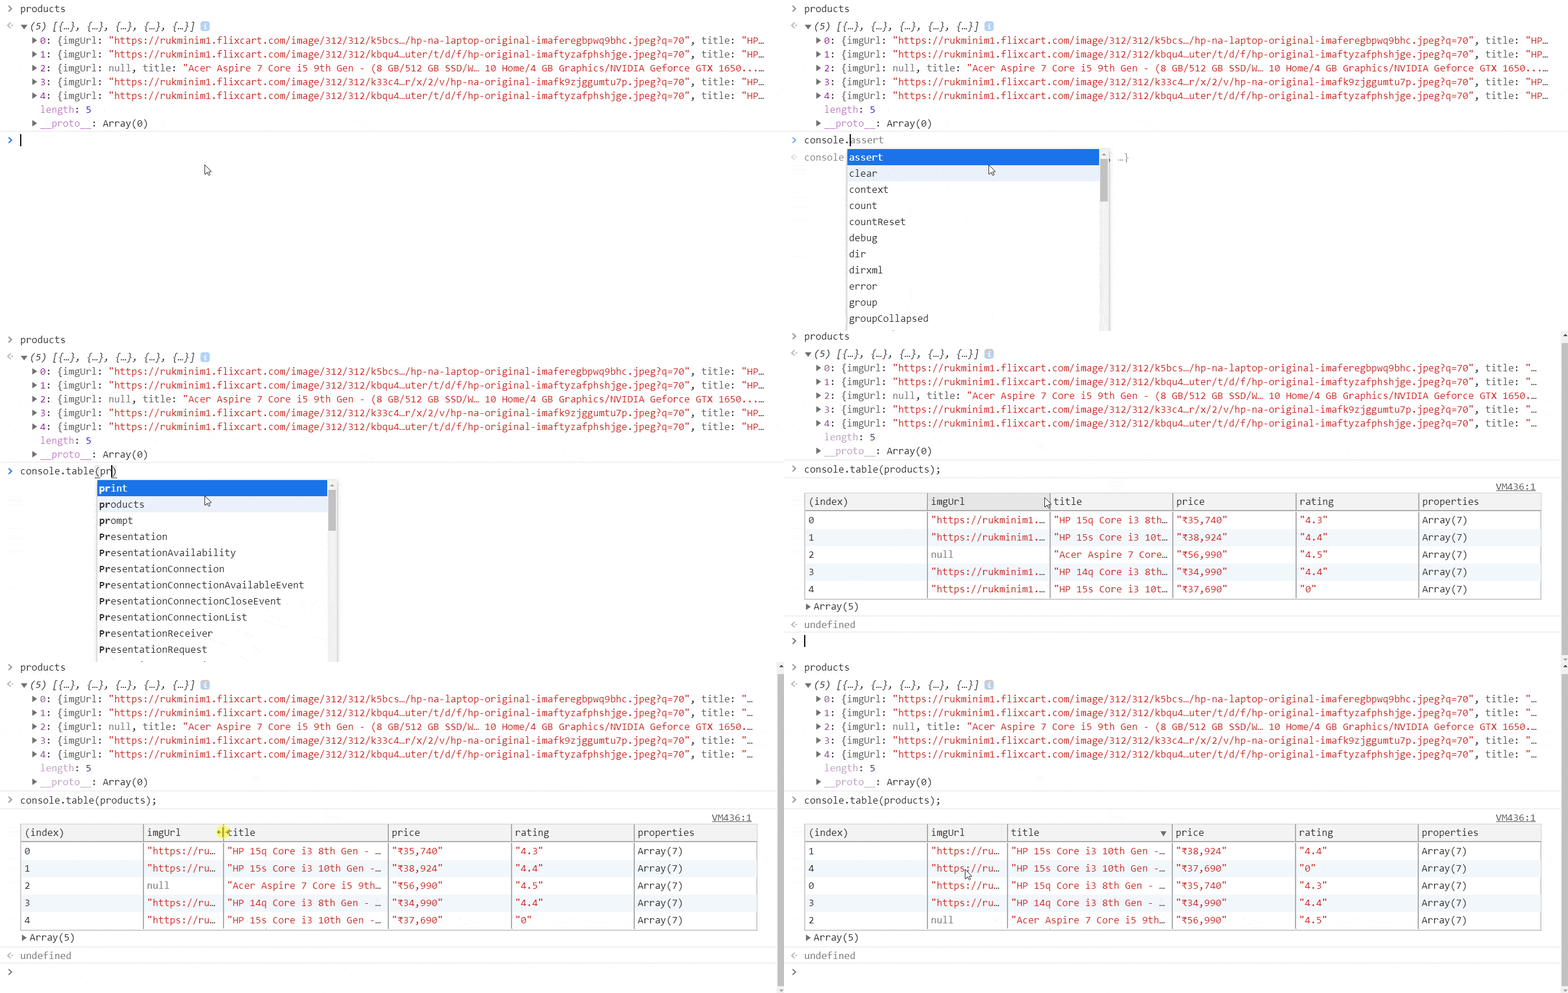
table(object) function show object array in table form.
We can also specify columns array to show the table of only specific object properties. here columns is a string array of object properties.
console.table(object [, columns]);
Generated table have a feature to sort data, as well as it gives the original object array below the table.
We can apply CSS styles to console log with %c console format specifier.
console.log("%c[TEXT TO LOG]", "[CSS STYLES]") 
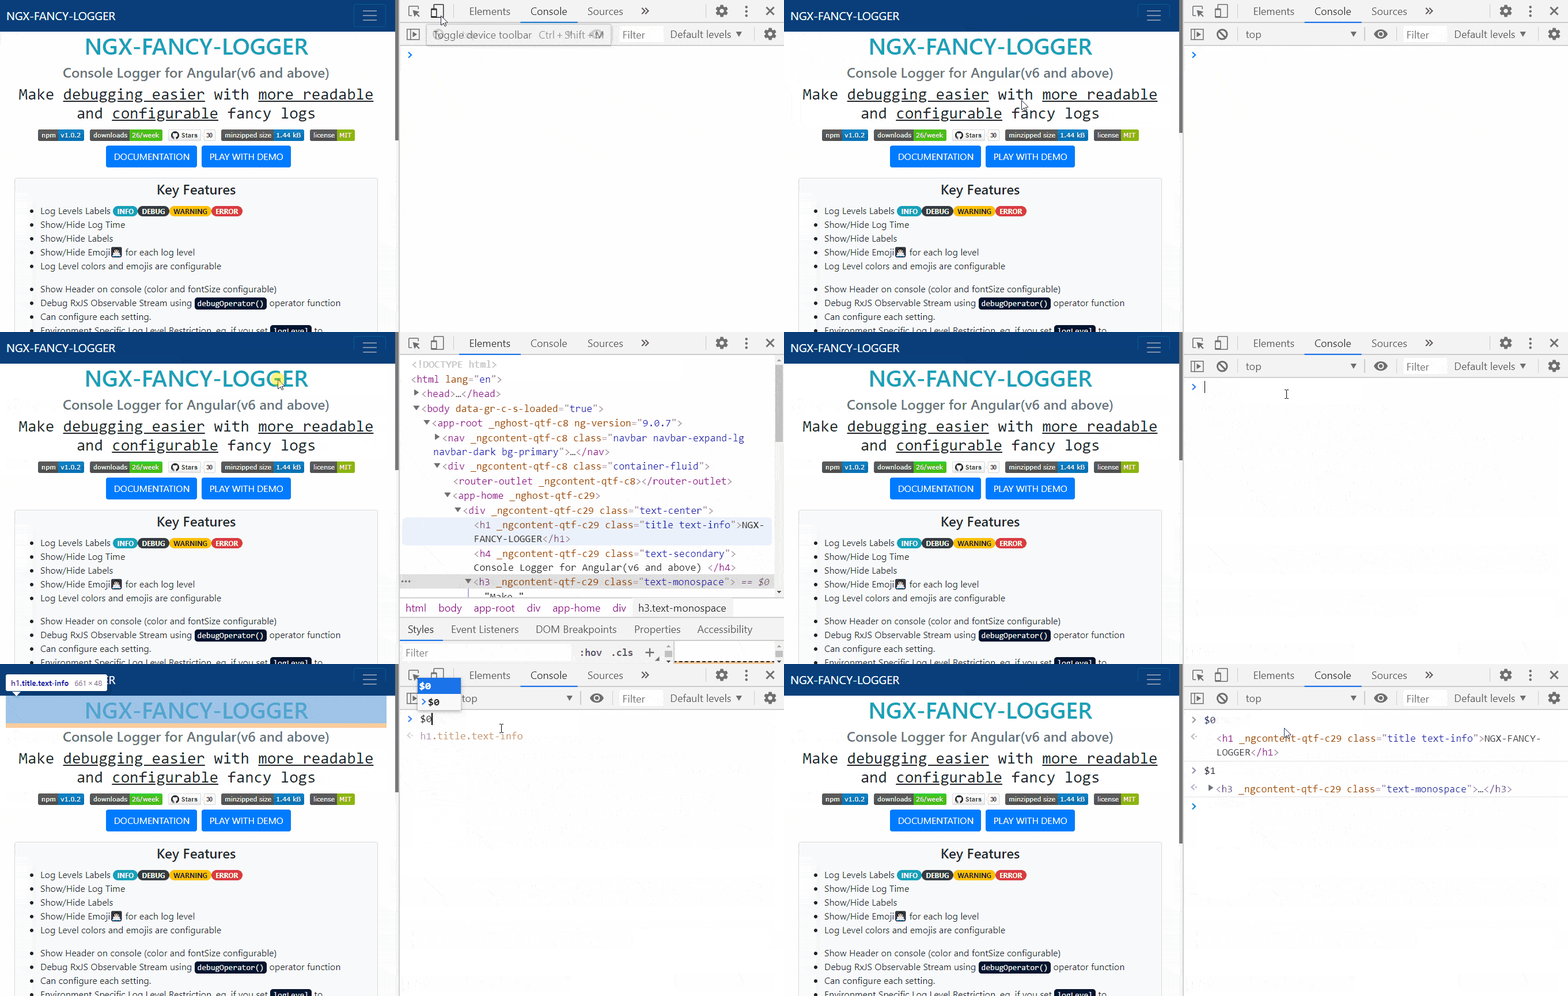
We can access the selected DOM element with $0 . also, we can access the last five selected elements with $1, $2 … to $5.
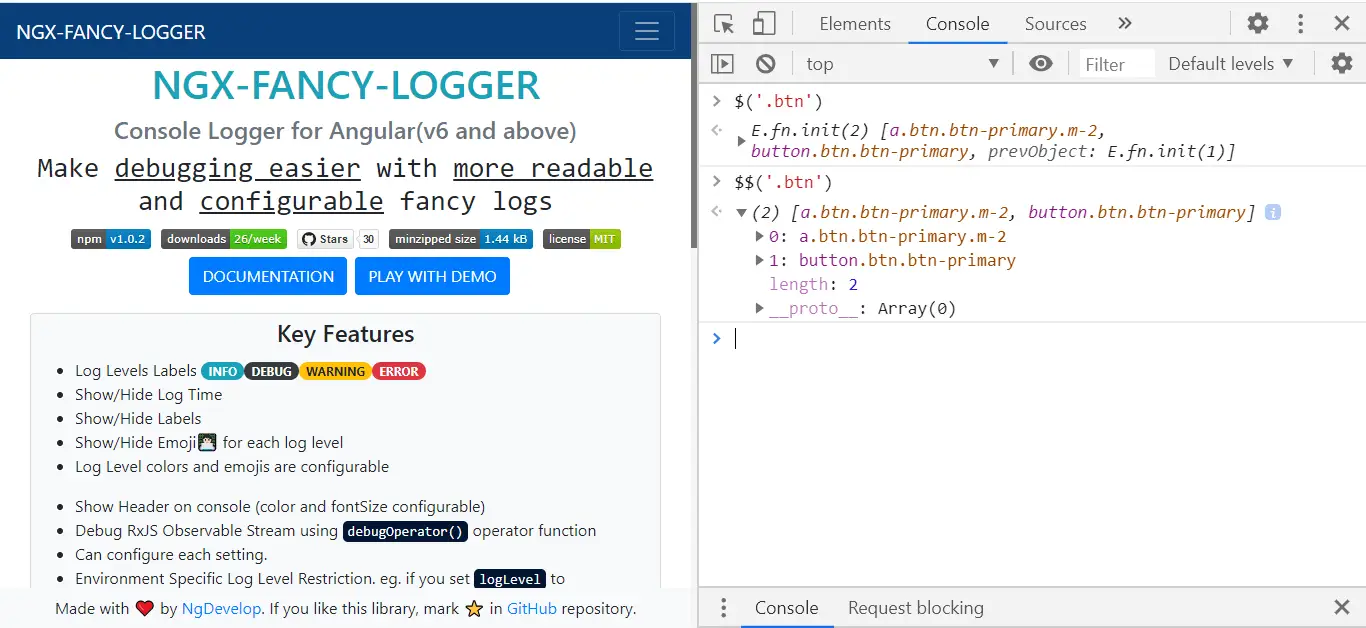
$(selector) returns the reference to the first DOM element with the specified CSS selector.
When called with one argument, this function is an alias for the document.querySelector() function.
startNode is an optional parameter, if you want to get the DOM element started from any specific DOM node.
$$(selector) returns an array of elements that match the given CSS selector.
This command is equivalent to calling document.querySelectorAll().
Same as $(selector), you can set the startNode .
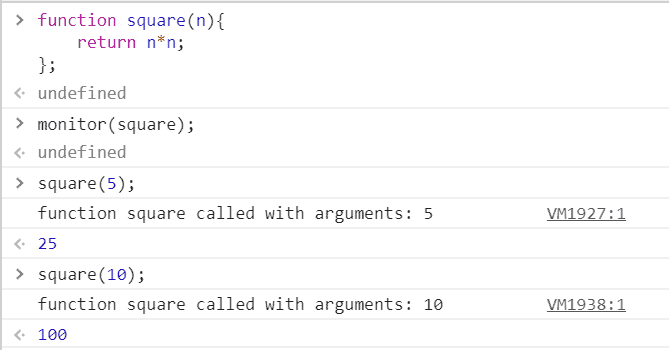
As name suggest, this function is used to monitor the function call of specified function.
When the function specified is called, a message is logged to the console that indicates the function name along with the arguments that are passed to the function when it was called.
To cancel monitoring of that function, use unmonitor(function).
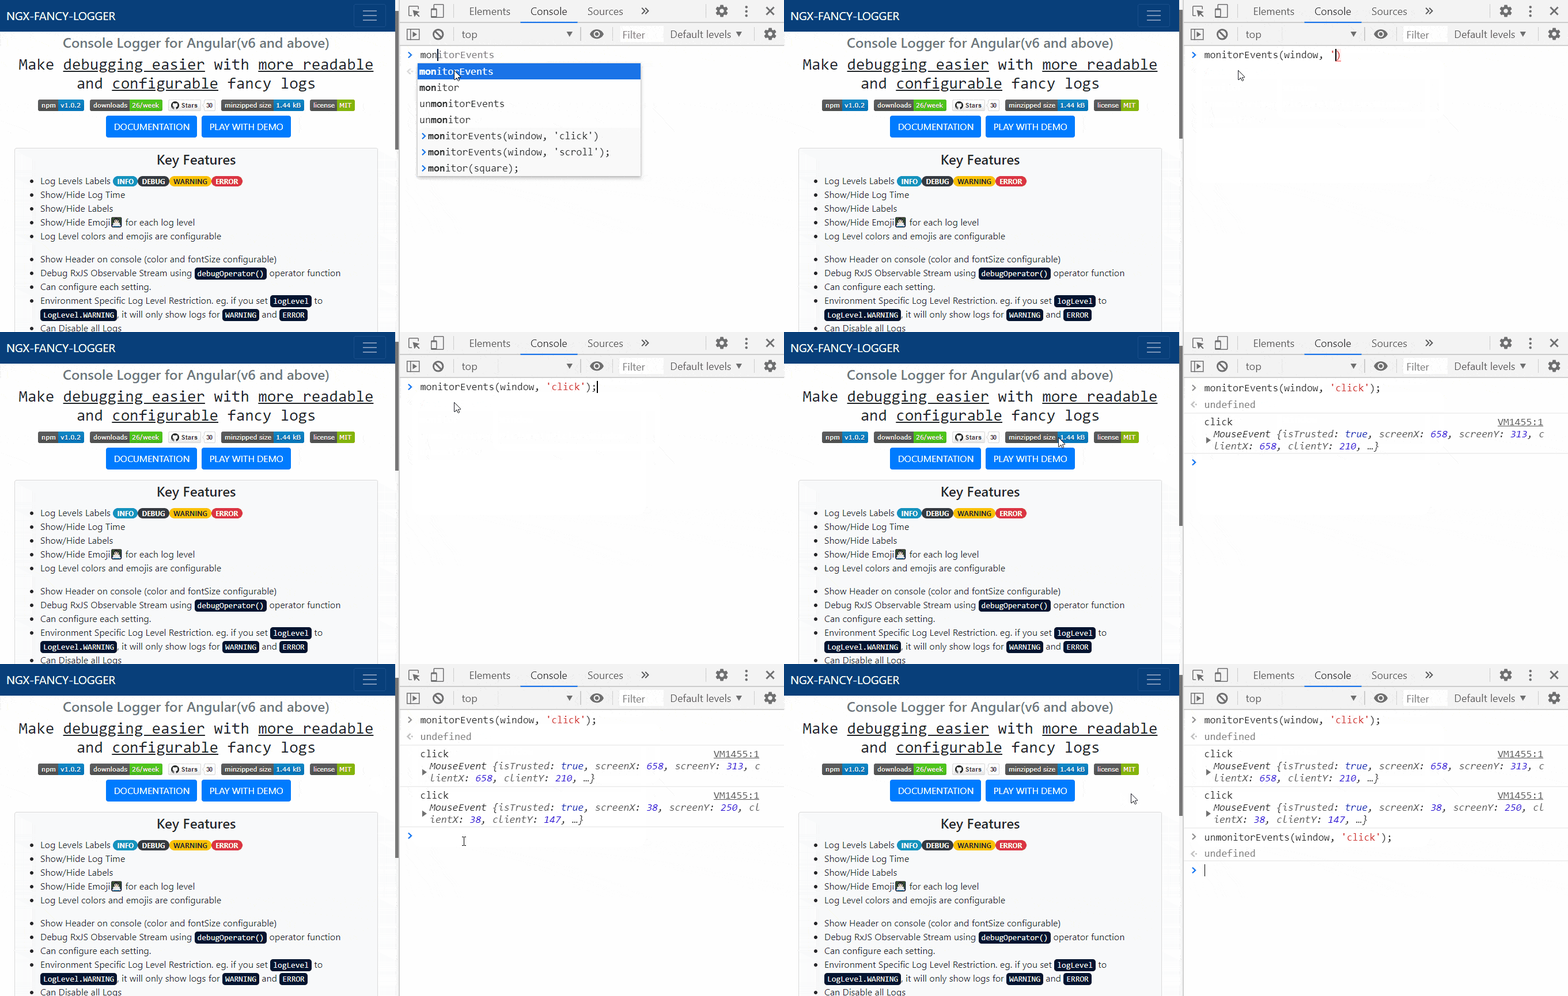
When one of the specified events occurs on the specified object, the Event object is logged to the console.
You can specify a single event to monitor, an array of events, or one of the generic events “types” mapped to a predefined collection of events.
As you can see in the example, We are monitoring click events on the window object.
To remove the monitoring on that object, use unmonitorEvents(object[, events])
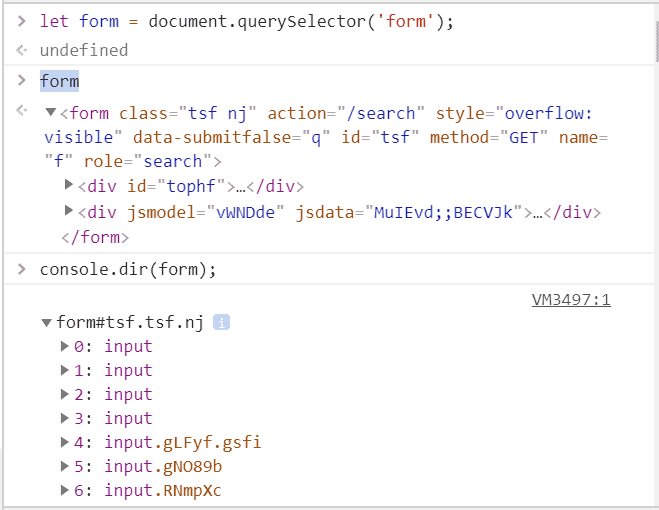
dir(object) displays an object-style listing of all the specified object’s properties. This method is an alias for the Console API’s console.dir() method.
As you can see in below example, console.dir(form) generates the object representation of form.
In this article, we have seen some useful Chrome DevTools Tips and Tricks.
We have seen how to capture a screenshot with various requirements, Inspecting animation, Using box-shadow picker and color picker, Emulating vision deficiency, Using chrome dev tools theme, and Emulating print preview.
Other than this, we have seen important console features that help to debug and inspect the DOM element.
I hope you like this article. Give your valuable feedback and suggestions in the below comment section🙂.
For more updates, Follow us 👍 on NgDevelop Facebook page.
